Our Products
 Loans
Loans
 Cards
Cards
 Insurance
 Investment
 Stock Market
 Electronics Mall
 CIBIL Score
 Knowledge Centre
 Calculators
Our Services

 Do not call
 En
En
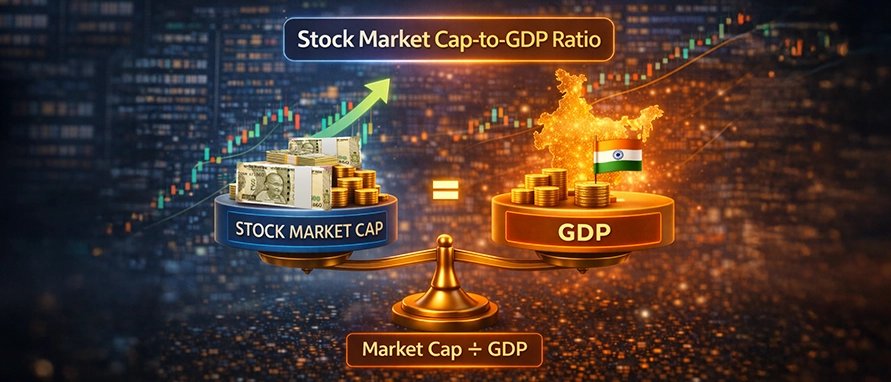
Learn what the stock market cap-to-GDP ratio is, how it is calculated, and how it is used to assess overall market valuation.
The Market Cap to GDP ratio is a widely used indicator that helps investors and economists assess the valuation of a country's stock market relative to its overall economy. It offers a snapshot of how the stock market is performing compared to the national output and helps in determining whether the market is overvalued or undervalued. In India, like in other economies, this ratio is widely tracked to gauge the market's health. This article explains the Market Cap to GDP ratio, how it works, its importance, and what it indicates about India's economic position.
Market capitalisation (market cap) refers to the total value of all listed shares on the stock market. It is calculated by multiplying the current share price of a company by its total outstanding shares. For example, if a company has 1 million shares and each share is priced at ₹1,000, the market cap would be ₹1 billion.
Market capitalisation serves as a measure of a company's size and gives an overview of the total value of a company's stock in the market. When referring to a country's stock-market capitalisation, the term generally denotes the aggregate market capitalisation of companies listed on its stock exchanges.
Gross Domestic Product (GDP) is the total value of goods and services produced within a country over a specific period (usually a year or a quarter). GDP measures the value of economic output produced within a country's domestic boundaries during a specified period. GDP can be calculated through three approaches:
Production approach: Adding the value of goods and services produced.
Income approach: Summing up all incomes earned by individuals and businesses in the country.
Expenditure approach: Measuring the total spending on the country's goods and services.
GDP is an important indicator because it represents the economic output of a country and is used for comparing the economic performance of different countries.
The Market Cap to GDP ratio is a financial metric that compares the total market capitalisation of a country's stock market to its Gross Domestic Product (GDP). It is a simple formula:
Market Cap to GDP Ratio = (Total Market Capitalisation / GDP) × 100
This ratio shows how large the stock market is relative to the size of the economy. A higher ratio indicates that the aggregate market capitalisation is larger relative to GDP, while a lower ratio indicates a smaller market capitalisation relative to GDP. The ratio should not be interpreted on its own as proof that a market is overvalued or undervalued.
To calculate the Market Cap to GDP ratio, the following steps are generally followed:
Find the total market capitalisation of the listed companies included in the relevant market or stock exchanges.
Find the country's GDP for the corresponding period, based on the methodology and data source being used.
Apply the formula:
Market Cap to GDP Ratio = (Total Market Capitalisation / GDP) × 100
For instance, if India's stock market capitalisation is ₹200 Lakh Crore, and India's GDP for the corresponding period is ₹200 Lakh Crore, then:
Market Cap to GDP Ratio = (200 / 200) × 100 = 100%
A ratio of 100% means that the market capitalisation used in the calculation is equal to the GDP figure used for the corresponding period. The reported ratio may vary depending on the market capitalisation measure, GDP period, data source, and calculation methodology.
In India, the Market Cap to GDP ratio has fluctuated over the years as stock market capitalisation and nominal GDP have changed. The ratio provides a broad comparison of the size of the Indian equity market with the country's economic output. A higher ratio indicates that market capitalisation is larger relative to GDP, while a lower ratio indicates a smaller market capitalisation relative to GDP. However, the ratio alone does not establish whether the market is overvalued or undervalued.
The ratio can vary depending on market conditions, changes in equity prices, economic growth, new listings, and the methodology used to calculate market capitalisation and GDP. Therefore, the period, data source, and methodology should be considered when interpreting the Market Cap to GDP ratio in India.
India's Market Cap to GDP ratio varies depending on the period, market capitalisation data, GDP figures, and methodology used for calculation. NSE reported a ratio of 135% as of December 31, 2025, based on a three-month average market capitalisation and nominal GDP for the preceding four quarters. The ratio can fluctuate over time as equity market capitalisation and GDP change.
The Market Cap to GDP ratio has varied over time, reflecting changes in market capitalisation and nominal GDP. The following figures are based on NSE-published data:
| Period | Approx. Market Cap to GDP Ratio | Source |
|---|---|---|
December 2024 |
138% |
NSE Annual Highlights |
December 2025 |
135% |
NSE Annual Highlights |
December 2025 |
135.50% |
NSE Market Pulse |
NSE's Market Pulse states that the ratio is based on the three-month average market capitalisation of NSE-listed companies and calendar-year nominal GDP. Therefore, the reported ratio may differ across sources depending on the period and methodology used.
For a longer historical series, NSE Market Pulse publications provide data on the ratio across multiple years.
The Market Cap to GDP ratio is a broad market-level indicator because:
Market Valuation Context: It provides a broad comparison between the aggregate market capitalisation of listed companies and the country's economic output. A higher ratio indicates that market capitalisation is larger relative to GDP, while a lower ratio indicates a smaller market capitalisation relative to GDP.
Relationship with Economic Output: The ratio shows how the size of the listed equity market compares with GDP. Changes in market capitalisation, GDP, or both can cause the ratio to increase or decrease over time.
Market-Level Context: The ratio can be used to track changes in the relationship between equity-market capitalisation and economic output. However, it does not independently establish whether a market is overvalued or undervalued and should be considered alongside other relevant economic and market indicators.
The Market Cap to GDP ratio varies across countries due to differences in stock-market size, economic structure, listed-company coverage, and the methodology used to calculate the ratio. Countries such as the United States may report a relatively high ratio, partly reflecting the size and international reach of their equity markets. Emerging markets such as India can have different ratios based on their market structure and level of listed economic activity.
| Country | Market Cap to GDP Ratio |
|---|---|
India |
Varies by period and methodology |
United States |
Varies by period and methodology |
China |
Varies by period and methodology |
Japan |
Varies by period and methodology |
Germany |
Varies by period and methodology |
The figures can differ across data sources depending on the market capitalisation used, the GDP period, stock exchanges covered, and calculation methodology. Therefore, country-level comparisons should be made using data calculated on a consistent basis.
While the Market Cap to GDP ratio is a useful indicator, it has some limitations:
Does Not Account for Market Composition: The ratio does not show how market capitalisation is distributed across sectors or companies. Differences in sector composition can affect the ratio and may make comparisons between markets less straightforward.
Challenges in International Comparison : Comparing the ratio across countries can be difficult because of differences in market structures, exchange coverage, regulations, sector composition, and methods used to measure GDP.
Excludes Unlisted Companies: The ratio is based on listed companies and does not capture the market value or economic activity of private and other unlisted businesses. As a result, it may not fully represent the size of the entire corporate sector.
Other than the Market Cap to GDP ratio, there are several other financial metrics commonly used to analyse equity markets and companies:
Price-to-Earnings (P/E) Ratio: Compares the price of a company's stock to its earnings per share.
Price-to-Book (P/B) Ratio: Measures the market value of a company relative to its book value.
Dividend Yield: The annual dividend income relative to the stock price.
The Market Cap to GDP ratio compares the aggregate market capitalisation of listed companies with a country's GDP. It provides a broad view of the relationship between the size of the equity market and economic output. In India, the ratio varies over time depending on changes in market capitalisation, GDP and the methodology used to calculate it. As a standalone measure, it does not establish whether the market is overvalued or undervalued and is understood as one source of market-level context.
The Market Cap to GDP ratio compares the aggregate market capitalisation of listed companies with a country's GDP. It indicates the size of the equity market relative to the economic output represented by GDP.
India's market cap-to-GDP ratio varies depending on the period, data source and methodology used. NSE reported a ratio of 135% at the end of December 2025.
The Market Cap to GDP ratio provides a broad comparison between the size of a country's listed equity market and its economic output. It can also help track how this relationship changes over time, although it does not by itself establish whether a market is overvalued or undervalued.
The ratio can change whenever market capitalisation or GDP changes. The frequency at which it is reported depends on the data source and methodology.
The Market Cap to GDP ratio can provide useful context, but comparisons across markets may be affected by differences in stock-exchange coverage, market structure, sector composition, GDP measurement and the methodology used to calculate the ratio.
.jpeg)












 Academy


.jpeg "image not found")