Our Products
Our Services
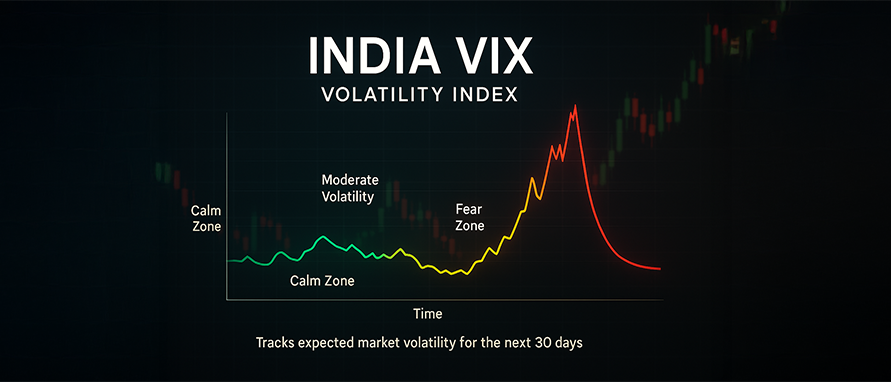
India VIX, often referred to as the ‘Fear Gauge’, represents the market’s expectation of 30-day volatility in the Nifty 50 Index, based on options pricing and prevailing market conditions.
India VIX is India’s volatility index, published by the National Stock Exchange (NSE), and is derived from option prices of the Nifty 50 index. It represents the level of volatility that is implied by market participants through Nifty option contracts for a 30-day forward period.
The index reflects expected price variability rather than market direction. Its value is expressed as an annualised percentage and is calculated using prices of near-term and next-term Nifty options across multiple strike prices. These option prices capture how the market is pricing future fluctuations in the Nifty 50.
India VIX serves as a statistical indicator of anticipated volatility embedded in option premiums at a given point in time. Changes in the index correspond to shifts in implied volatility arising from option market activity, rather than movements in the Nifty index itself.
India VIX was introduced by the National Stock Exchange (NSE) in 2008 as India’s official volatility index. It was developed to provide a standardised measure of expected market volatility based on the Nifty 50 Index, aligning Indian market infrastructure with global practices followed by major exchanges.
The methodology used for India VIX is adapted from the volatility index framework originally developed by the Chicago Board Options Exchange (CBOE), but it is customised for Indian market conditions and instruments. India VIX is calculated and disseminated by the NSE in real time during market hours, using prices of Nifty options.
Since its introduction, India VIX has functioned as a reference indicator within the Indian derivatives market, reflecting changes in implied volatility derived from option pricing rather than historical price movements. Its role is limited to representing volatility expectations and does not extend to forecasting market direction or outcomes.
The India VIX Index plays a structural role in describing how volatility expectations are reflected in the Indian equity derivatives market. Rather than indicating price direction, it provides a quantitative reference for how much variation market participants are pricing into the Nifty 50 over a defined time horizon.
India VIX captures implied volatility derived from Nifty option prices. Changes in the index reflect shifts in how market participants collectively price uncertainty, based on available information, option demand, and prevailing market conditions.
Movements in India VIX are often examined alongside broader market activity to understand whether trading conditions are relatively stable or experiencing heightened uncertainty. This contextual role helps frame market behaviour without attributing causality or outcomes.
Since India VIX is constructed using option prices, it is closely linked to activity in the derivatives segment. Its levels provide a consolidated view of how volatility is being priced across multiple strikes and maturities, rather than relying on individual option contracts.
By expressing expected volatility as a standardised percentage, India VIX allows comparisons across different market phases. This makes it possible to observe how volatility expectations have varied historically during different economic, policy, or global market environments.
India VIX is frequently referenced in market commentary, research, and reporting to describe prevailing volatility conditions. Its role is informational, offering a common volatility benchmark grounded in exchange-traded data rather than opinion-based measures.
Overall, the importance of the India VIX Index lies in its ability to summarise market-implied volatility expectations in a single metric, contributing to a clearer understanding of prevailing risk conditions within the Indian equity market framework.
India VIX is calculated using a methodology adapted from the volatility index framework developed by the Chicago Board Options Exchange (CBOE), with modifications to suit the structure and liquidity of the NIFTY options market. The calculation is based on option price data and reflects the market’s implied volatility expectations over a 30-day horizon.
India VIX is derived from the weighted aggregation of implied volatilities of selected NIFTY option contracts. The computation can be expressed conceptually as:
India VIX = 100 × √( Σ (Weighted Implied Volatility²) ÷ Total Weight )
Where:
Weighted Implied Volatility² represents the squared implied volatility of each option multiplied by its assigned weight
Total Weight represents the sum of weights applied to all option contracts included in the calculation
This approach produces an annualised volatility figure, which is then expressed as a percentage.
The India VIX calculation incorporates several technical inputs drawn from the NIFTY options order book:
Time to expiry is measured in minutes rather than days. This granular approach allows the calculation to reflect precise remaining contract life for near-term and next-term option expiries.
Interest Rate
A risk-free interest rate corresponding to the relevant short-term maturity (generally within the 30- to 90-day range) is applied. This rate aligns with the option expiry period used in the computation.
Forward Index Level
India VIX is computed using out-of-the-money (OTM) option contracts. To identify the appropriate option strikes, the forward index level is first determined.
This forward level is derived from the most recently available NIFTY futures price for the corresponding expiry and is used to identify the at-the-money (ATM) strike.
Option Selection and Bid–Ask Prices
Call options with strike prices above the ATM level and put options with strike prices below the ATM level are included in the calculation.
For each eligible option contract, the midpoint of the prevailing bid and ask prices is used to derive implied volatility.
If bid–ask quotations are unavailable for certain strike prices, values are estimated using a statistical interpolation method known as a natural cubic spline.
Volatility (variance) is calculated separately for the near-month and next-month option expiries. These values are then combined using time-based weighting to arrive at a single 30-day implied volatility estimate, which is published as the India VIX value.
India VIX is a volatility index that reflects the level of price fluctuation expected by market participants over a defined time horizon. It is derived from option prices linked to the Nifty 50 Index and represents implied volatility rather than actual price movement. Published by the National Stock Exchange of India, the index provides a standardised reference point for understanding prevailing market conditions.
As a volatility measure, India VIX is commonly referenced in market analysis to observe changes in uncertainty reflected in option pricing. Rising or falling levels indicate shifts in how participants price risk, without indicating the direction in which the underlying index may move.
From a market-structure perspective, India VIX is used across several analytical contexts:
Market activity assessment: Changes in the index highlight variations in implied volatility derived from Nifty option contracts.
Options market context: Since the index is calculated using option premiums, it reflects conditions specific to the derivatives segment.
Event-related observation: Movements in India VIX are often seen around macroeconomic announcements, policy actions, or global developments, reflecting changes in expected variability rather than confirmed outcomes.
Comparative analysis: The index allows volatility levels to be compared across time periods, supporting historical or trend-based examination.
India VIX functions as a descriptive indicator within the broader market framework. It does not provide forecasts or directional signals but offers insight into how volatility expectations evolve based on traded option prices.
India VIX and the Nifty 50 Index represent two different dimensions of the Indian equity market and are used for distinct analytical purposes. While the Nifty 50 reflects price movements of large-cap equities, India VIX reflects the market’s implied expectation of volatility derived from Nifty option prices.
The Nifty 50 is a benchmark index that tracks the performance of 50 actively traded companies listed on the National Stock Exchange. Its value changes based on the price movements of its constituent stocks and is commonly referenced to understand overall market direction and performance.
India VIX, in contrast, does not track price levels or returns. It is a volatility index calculated using near- and next-month Nifty option contracts and represents expected price fluctuation over a 30-day period. The index expresses this expectation in percentage terms and is independent of whether the Nifty moves upward or downward.
Because India VIX is derived from option premiums, it often changes in response to shifts in market uncertainty, event risk, or changes in demand for hedging. The Nifty 50, on the other hand, responds directly to buying and selling activity in underlying equities.
In practical market observation, the two indices may sometimes move in opposite directions, such as when rising uncertainty leads to higher implied volatility even if prices are stable, but this relationship is not fixed or deterministic. Each index serves a separate informational role within the market framework.
Together, India VIX and the Nifty 50 provide complementary views: one reflecting price-based market performance, and the other reflecting volatility expectations embedded in derivative markets.
India VIX is part of a broader category of volatility indices that measure expected short-term market fluctuations using option prices. While the underlying calculation approach is similar across markets, each volatility index is specific to its domestic benchmark.
| Feature | India VIX Index | CBOE VIX (US) |
|---|---|---|
Based on |
Nifty 50 options |
S&P 500 options |
Exchange |
National Stock Exchange (NSE) |
Chicago Board Options Exchange (CBOE) |
Time Horizon |
30-day implied volatility |
30-day implied volatility |
Volatility Type |
Implied volatility |
Implied volatility |
Although both indices reflect expected volatility over a 30-day period, they differ in underlying markets, instruments, and exchange frameworks.
To illustrate how the India VIX index responds to changing conditions, consider a scenario where an unexpected global development leads to uncertainty in financial markets.
Expectations of wider price movements in the Nifty 50 increase
Option premiums for near-term Nifty contracts rise
Implied volatility embedded in option prices increases
As a result, the India VIX value may move from a lower range (such as around 15) to a higher level (such as above 25), reflecting elevated expectations of short-term market fluctuation rather than a directional price outcome.
India VIX represents the market’s expectation of short-term volatility in the Nifty 50, derived from option prices and standardised calculation methods. While it does not indicate the direction of price movement, it reflects how market participants are pricing near-term uncertainty within the equity market.
This content is for informational purposes only and the same should not be construed as investment advice. Bajaj Finserv Direct Limited shall not be liable or responsible for any investment decision that you may take based on this content.
The India VIX index measures the implied volatility expected in the Nifty 50 over the next 30 days, based on prices of Nifty index options traded on the National Stock Exchange.
India VIX is calculated using bid-ask mid-prices of near-month and next-month Nifty options, applying weighted variance across strike prices and adjusting for time to expiry to derive a 30-day implied volatility figure.
A higher India VIX level reflects expectations of larger short-term price fluctuations, while a lower value indicates expectations of relatively limited price movement over the same period.
India VIX and CBOE VIX both measure 30-day implied volatility, but India VIX is based on Nifty 50 options traded on NSE, whereas CBOE VIX is derived from S&P 500 options traded in the US market.
India VIX reflects the level of price fluctuation the market expects in the Nifty 50 over the next 30 days. Higher values indicate that wider price movements are being anticipated, while lower values suggest expectations of relatively stable market conditions.
.jpeg)


Navigate the tax maze with ease! Uncover Income Tax 101, demystify jargon with Terms for Beginners, and choose between Old or New Regimes.

Unlock the world of credit! From picking the perfect card to savvy loan management, navigate wisely.

Money Management and Financial Planning covers personal finance basics, setting goals, budgeting...

Explore the investment cosmos! From beginner's guides to sharp-witted strategies, explore India's treasure trove of options.

Discover essential insights on various types of insurance in India.

Welcome to Tech in Finance, where we explore the exciting intersection of technology and finance...


